Key Figures
SF Urban Properties Ltdas at 29 February 2024
| Share Price CHF | 92.00 |
Description
SF Urban Properties Ltd (SFUP) is a Swiss real estate company based in Zurich. It invests in residential, commercial and development properties with a focus on the cities of Zurich and Basel. Its strategy is geared towards economic areas and locations that show more potential than others due to demographic, legal or economic conditions or their changes.
Company Data
| Company | SF Urban Properties Ltd |
| Legal form | Swiss Corporation (AG) |
| CEO | Bruno Kurz |
| CFO | Sascha Küng |
| Asset manager | Swiss Finance & Property Funds Ltd |
| Valuation expert | Wüest Partner AG |
| Market Maker | Swiss Finance & Property Ltd |
| Holding structure real estate | Direct property |
| Benchmark | REAL Index |
| Management fee | 0.75% (NAV); 0.5% > 250 Mio. |
| Auditors | PricewaterhouseCoopers |
| SIX Swiss Exchange listing | 17 April 2012 |
| Portfolio value investment properties | CHF 745.6 mn (as at 31 decembre 2023) |
| Security number | 3281613 |
| ISIN number | CH0032816131 |
| Bloomberg code | SFPN SW Equity |
| Distribution for 2023 | CHF 3.60 |
| Distribution yield as at 31 December 2023 | 3.87% |
Market Value by Region
Type of Usage
Performance
(reset on base 100)
Cumulative Performance
| YTD | 1 mt | 3 mts | 1 year | 3 years | 5 years | Since Inception | |
| SFUP | -1.08% | -1.60% | 5.14% | 6.45% | 9.80% | 24.77% | 122.16% |
| Benchmark | -3.01% | -1.90% | -1.15% | 8.00% | 7.00% | 24.79% | 180.76% |
Ratios
| Ratios on return and performance | Unit | 31 Dec. 2023 | 31 Dec. 2022 |
| Investment yield | % | -3.07 | 14.89 |
| EBIT margin investment properties excl. revaluation | % | 61.90 | 62.72 |
| Return on equity (ROE) excl. Revaluation | % | 3.81 | 3.82 |
| Distribution yield | % | 3.87 | 4.04 |
| Ratios on the financial markets | Unit | 31 Dec. 2023 | 31 Dec. 2022 |
| Premium | % | -17.82 | -26.06 |
| Share price | CHF | 93.00 | 89.00 |
| Ratios on the balance sheet | Unit | 31 Dec. 2023 | 31 Dec. 2022 |
| Market value of properties | CHF | 745 645 483 | 754 465 229 |
| Gross asset value | CHF | 836 463 615 | 861 377 725 |
| Net fund assets | CHF | 379 966 710 | 406 419 725 |
| Borrowing ratio | % | 44.30 | 41.58 |
| LTV (Loan-to-Value) | % | 45.94 | 44.60 |
| Ratios on the income statement | Unit | 31 Dec. 2023 | 31 Dec. 2022 |
| Rental income | CHF | 29 763 440 | 28 389 853 |
| Total operating income before revaluations | CHF | 51 870 062 | 63 987 180 |
| Ratios on the units | Unit | 31 Dec. 2023 | 31 Dec. 2022 |
| Net asset value | CHF | 113.17 | 120.36 |
| Distribution per unit | CHF | 3.60 | 3.60 |
| ‒ of which free of withholding tax | CHF | 2.90 | 3.60 |
| Units at end of reporting period | pc. | 3 351 930 | 3 351 930 |
| Ratios on the portfolio | Unit | 31 Dec. 2023 | 31 Dec. 2022 |
| Number of investment properties | pc. | 47 | 48 |
| Number of development properties | pc. | 6 | 6 |
| Gross yield | % | 4.20 | 3.94 |
| Real discount rate | % | 2.76 | 2.70 |
| Nominal discount rate | % | 4.05 | 3.72 |
| Vacancy rate as at reporting date | % | 1.26 | 1.51 |
| WAULT in years | years | 3.70 | 4.20 |
GRESB Rating
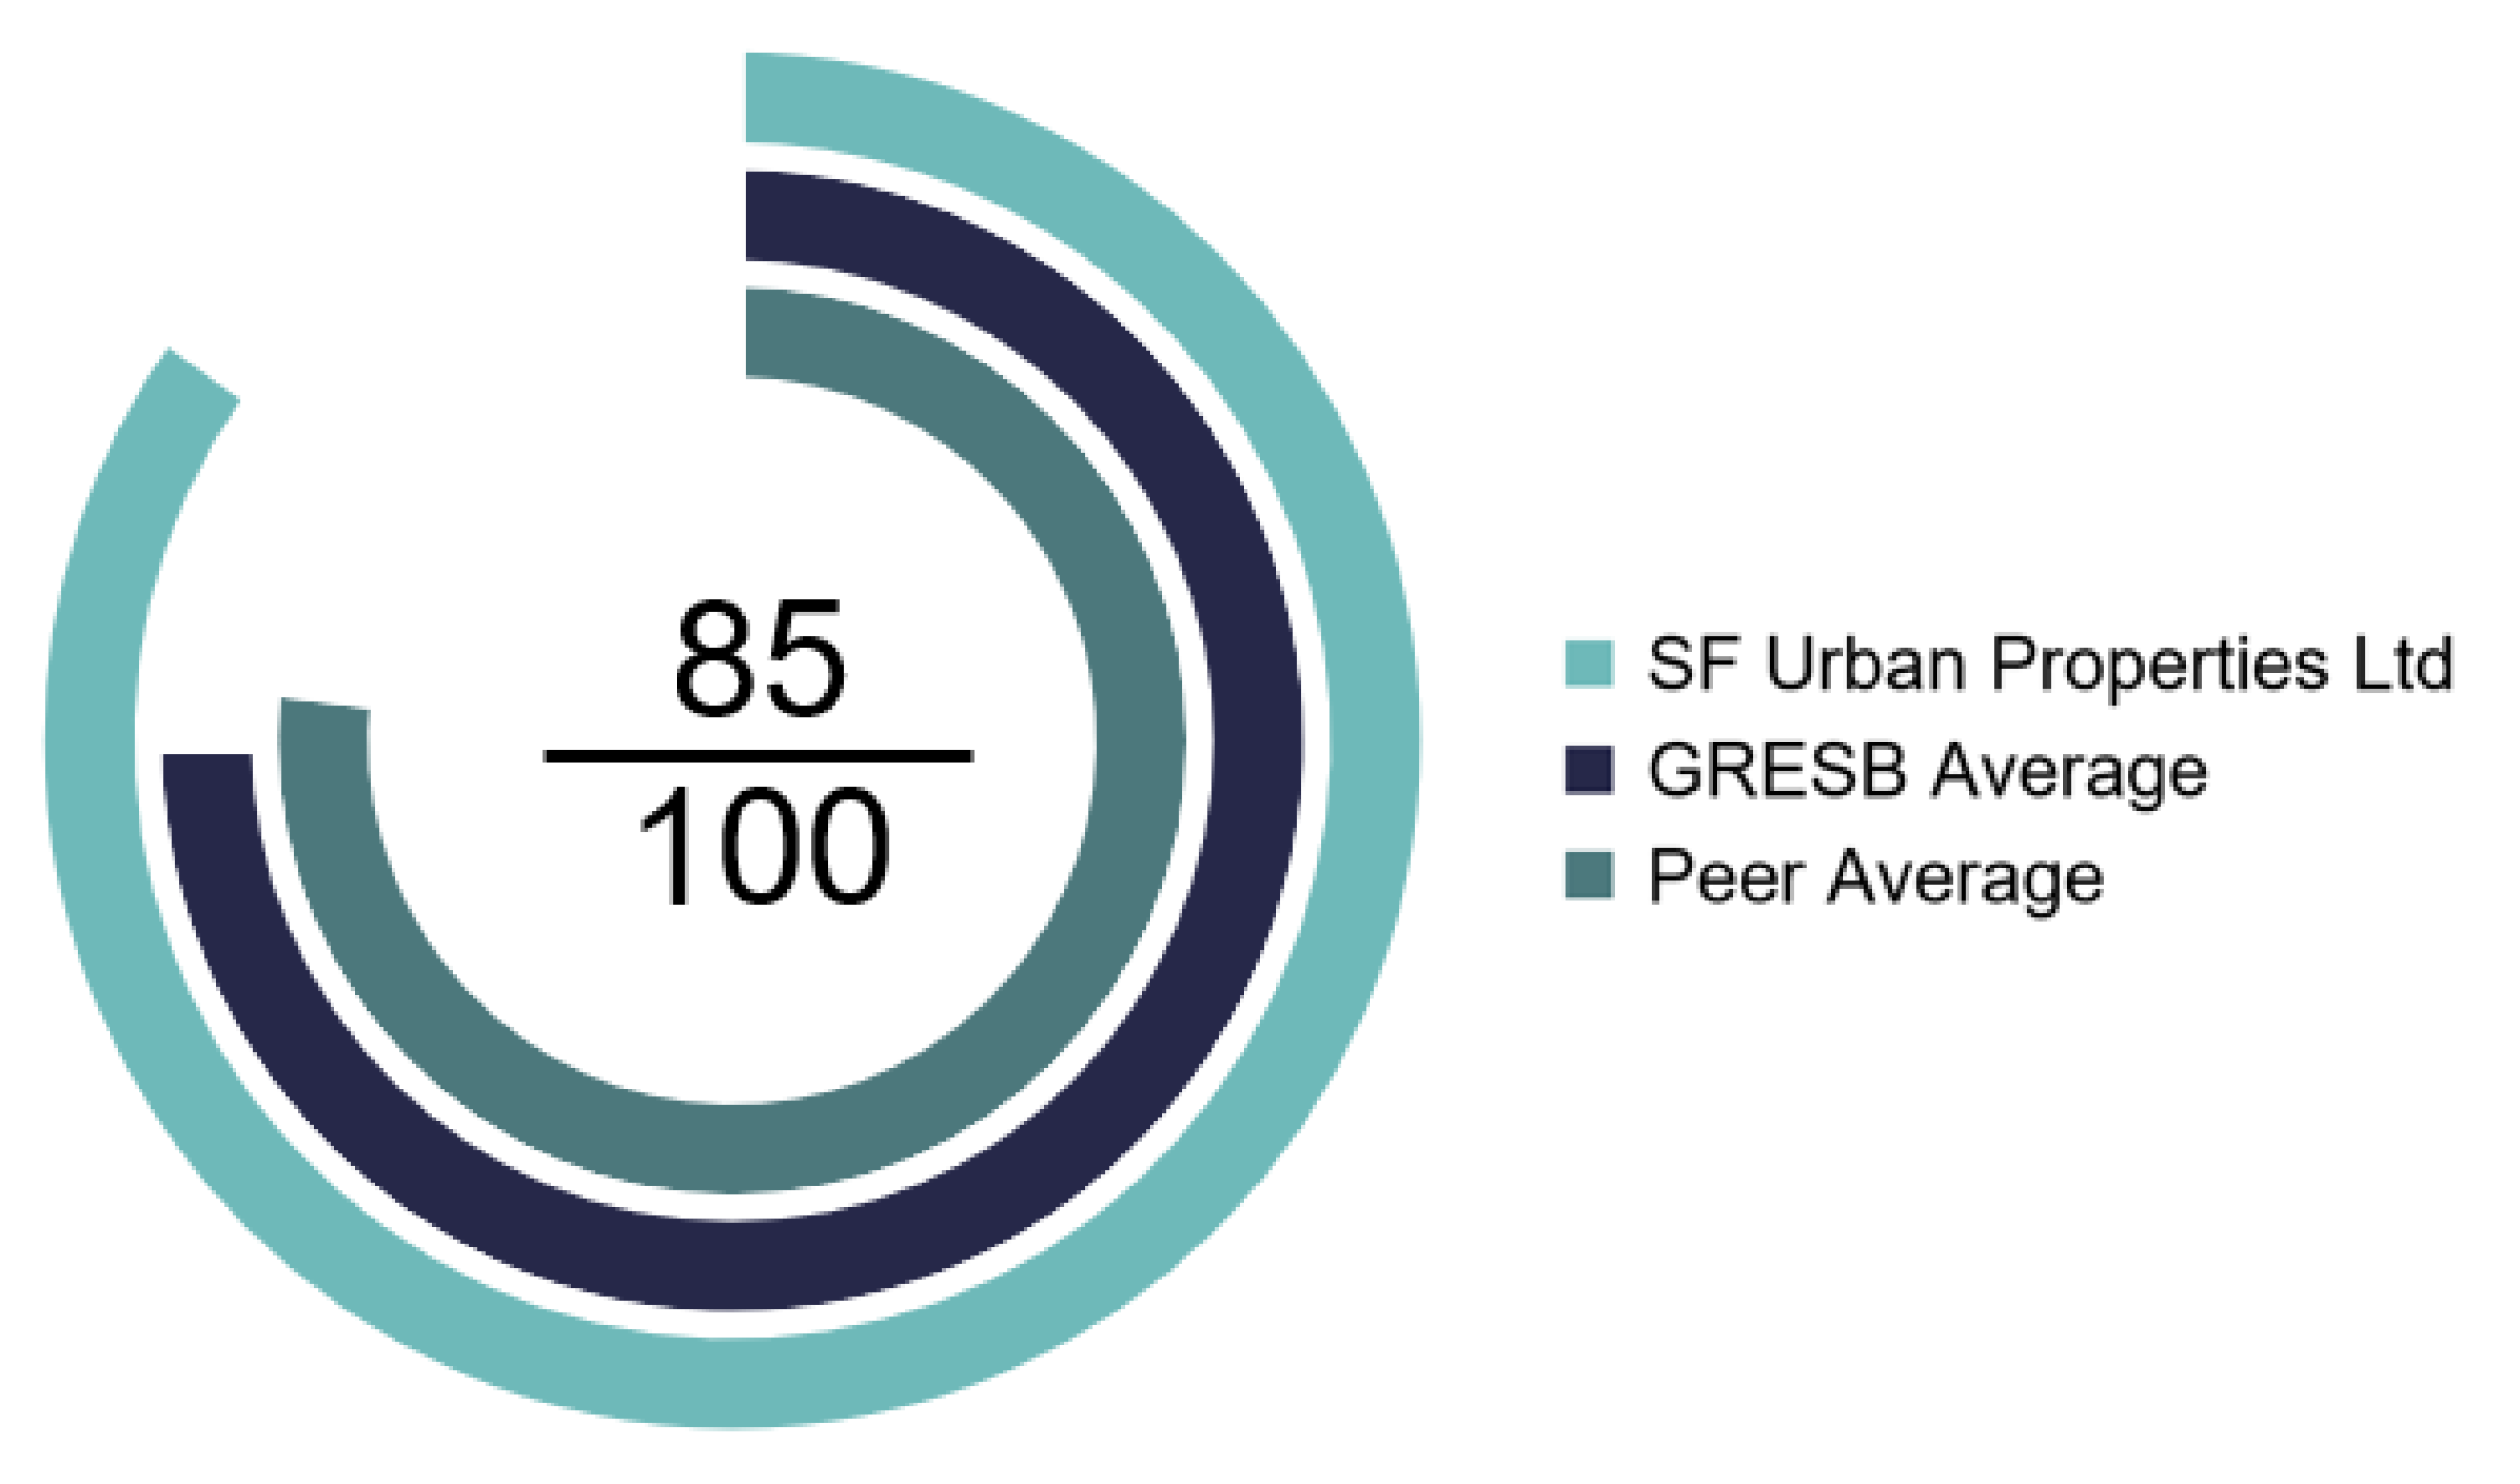
| GRESB Rating Standing Investment | 4 out of 5 |
| GRESB Score Standing Investment | 85 out of 100 |
| GRESB Average | 75 out of 100 |
| GRESB Peer Average | 77 out of 100 |
GRESB Portfolio Summary
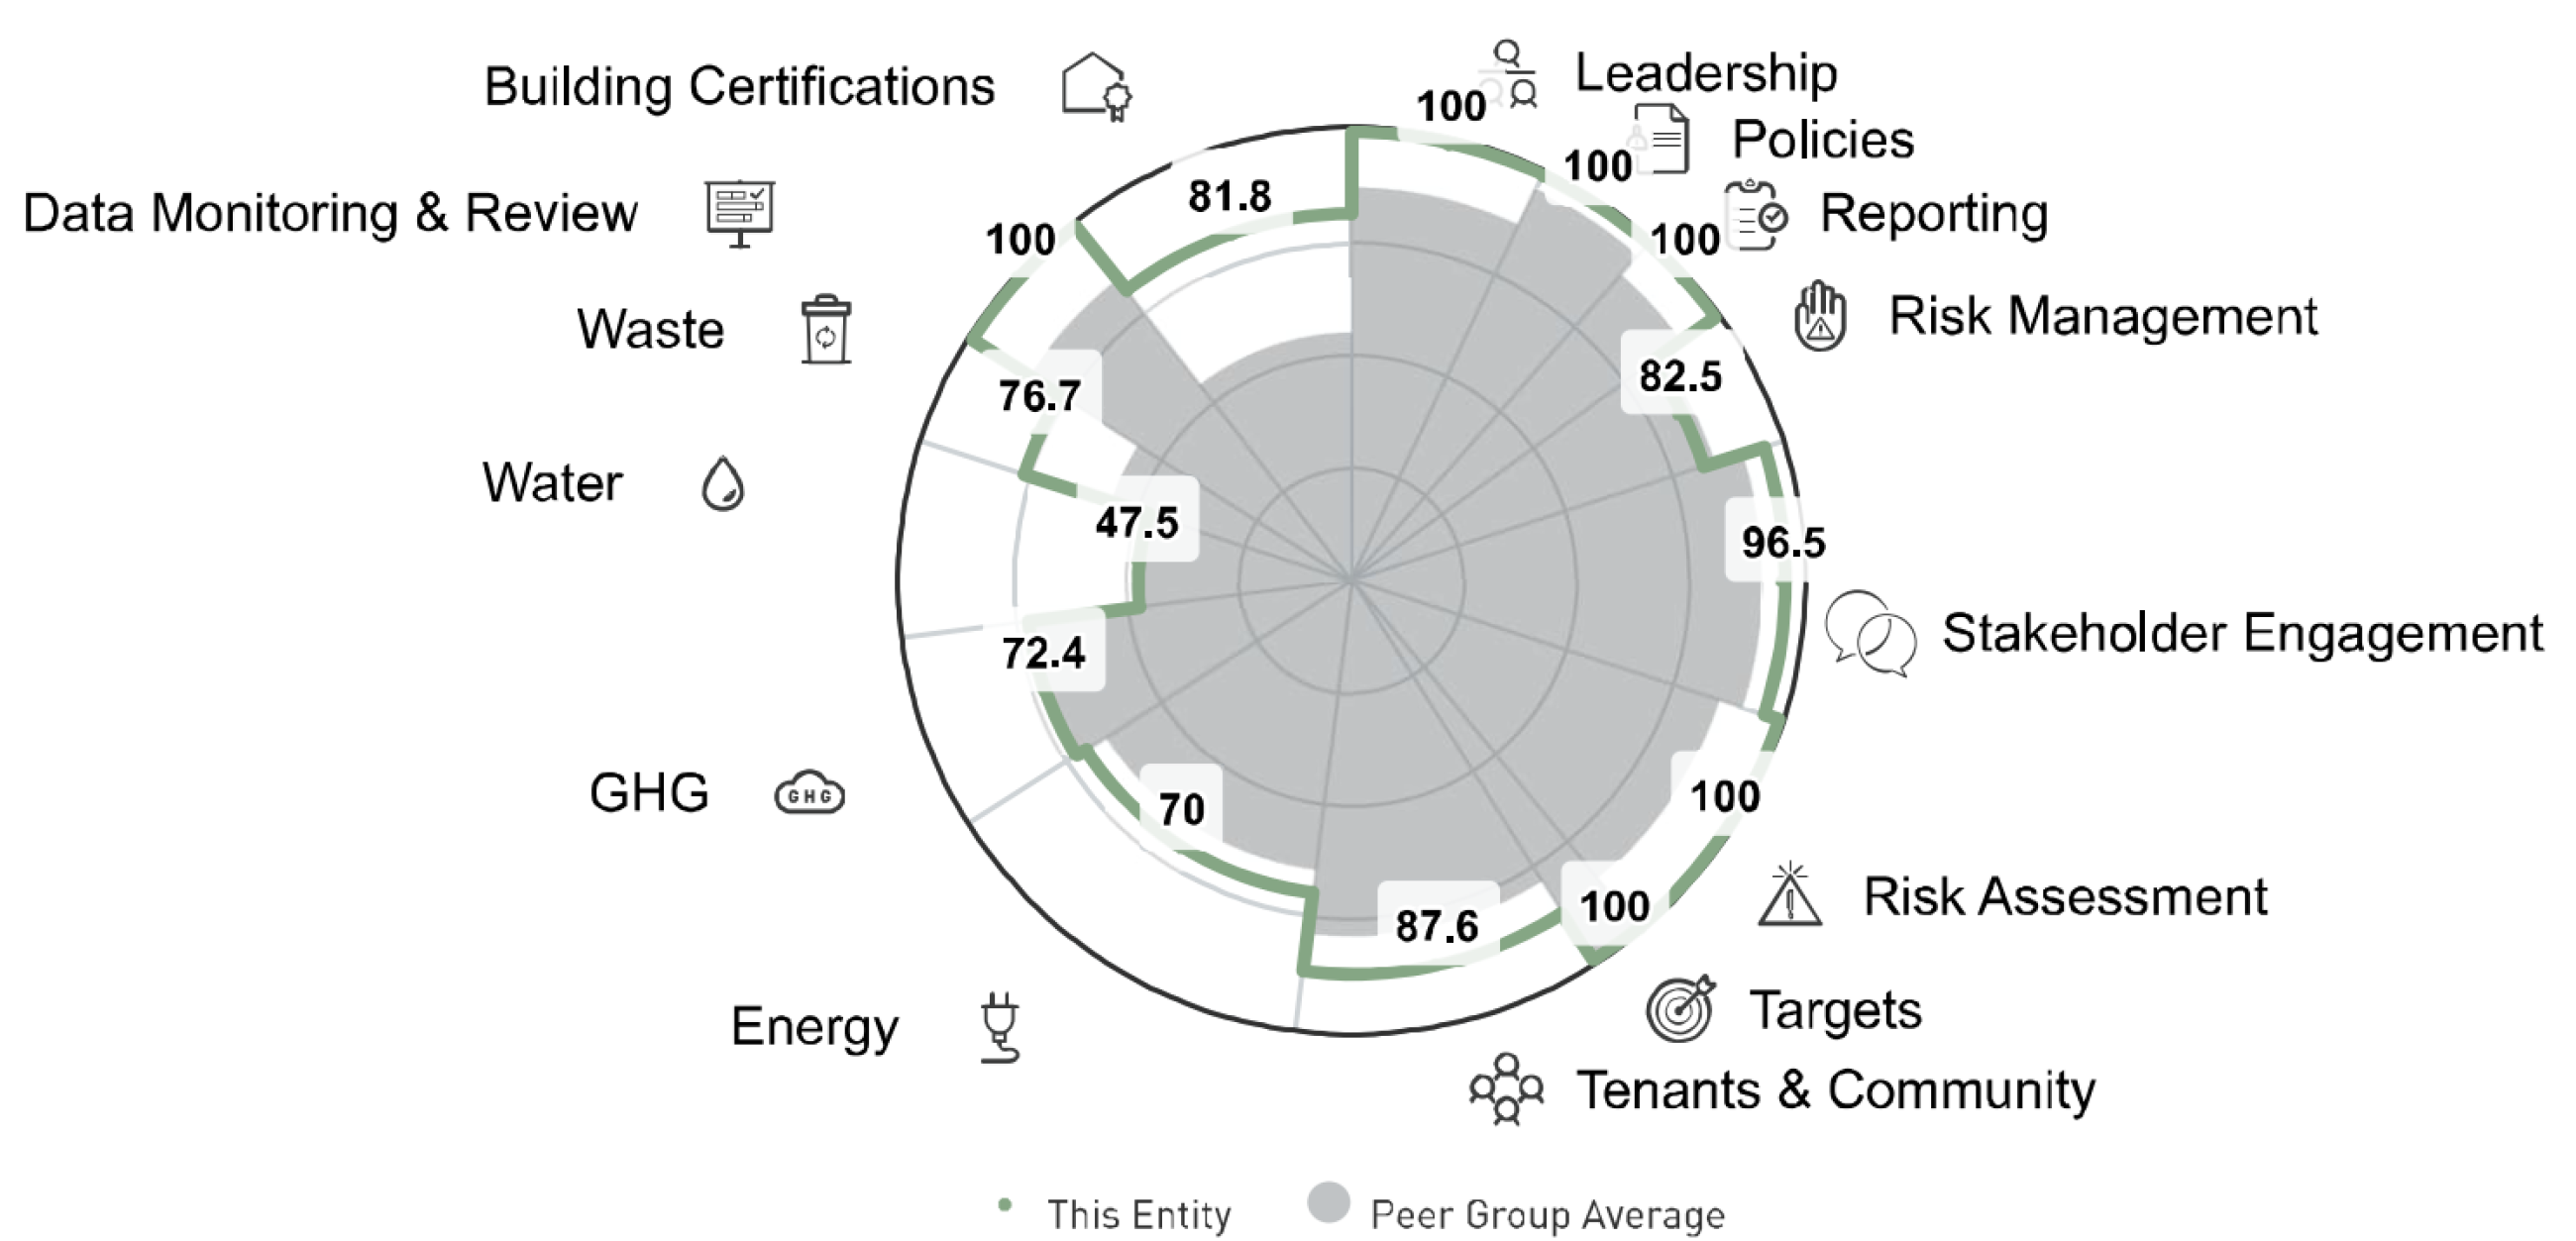
Source: GRESB
All intellectual property rights to this data belong exclusively to GRESB B.V. All rights reserved. GRESB B.V. has no liability to any person (including a natural person, corporate or unincorporated body) for any losses, damages, costs, expenses or other liabilities suffered as a result of any use of or reliance on any of the information which may be attributed to it.
GRESB ESG Breakdown
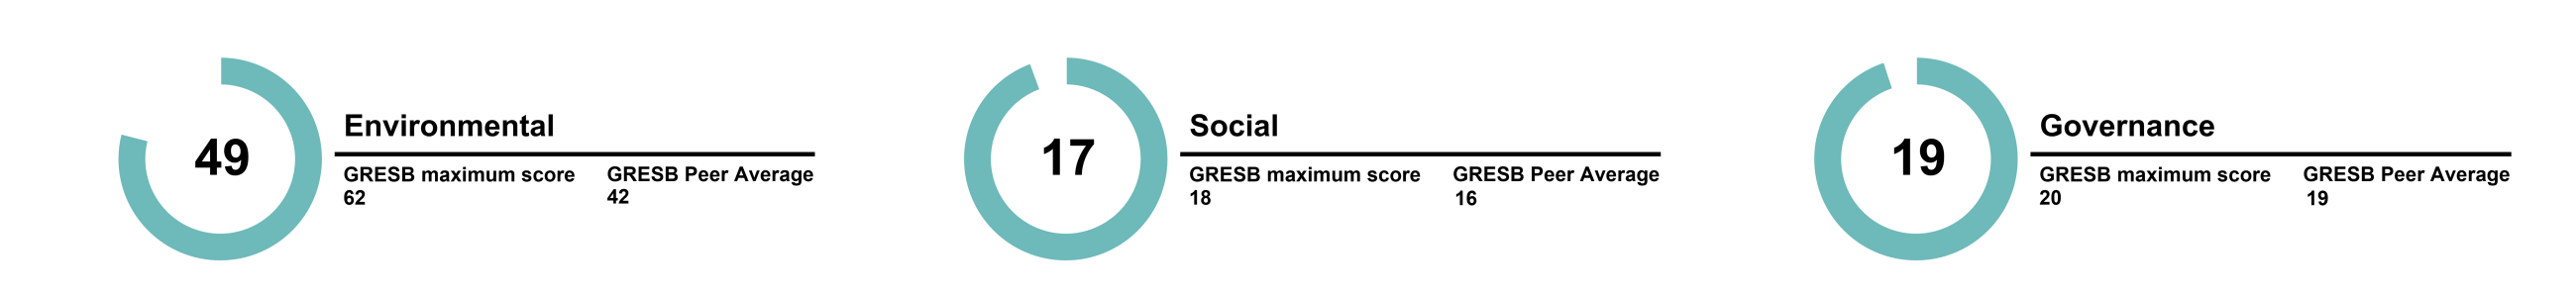
Source: GRESB
The information in the factsheet linked below is relevant.